Last updated 27 June 2026. Source: AirDNA, Southwest Florida market averages.
The average short-term rental in Southwest Florida grosses about $51,600 a year across 35,723 active listings, at an average daily rate near $308 and roughly 59 percent occupancy. The spread behind that average is wide. Naples averages $53,803 a year, Cape Coral and Fort Myers $44,984, and Punta Gorda $37,514.
The average Airbnb income in Southwest Florida is not one number. It is a band, and where a property lands inside that band depends on which market, which neighborhood, what property type, and how the home is managed. This report covers the four Southwest Florida markets and the highest-earning neighborhoods inside them, using AirDNA data with a peak date of 27 June 2026.
The headline pattern is the same in every market: demand is stable, supply has grown, and the gap between professionally managed and self-managed performance is visible in the daily rate. Buying a property in Southwest Florida no longer carries the listing on its own. Active pricing, listing quality and review discipline decide whether a home earns at the median or well above it.
Southwest Florida vacation rental income by market
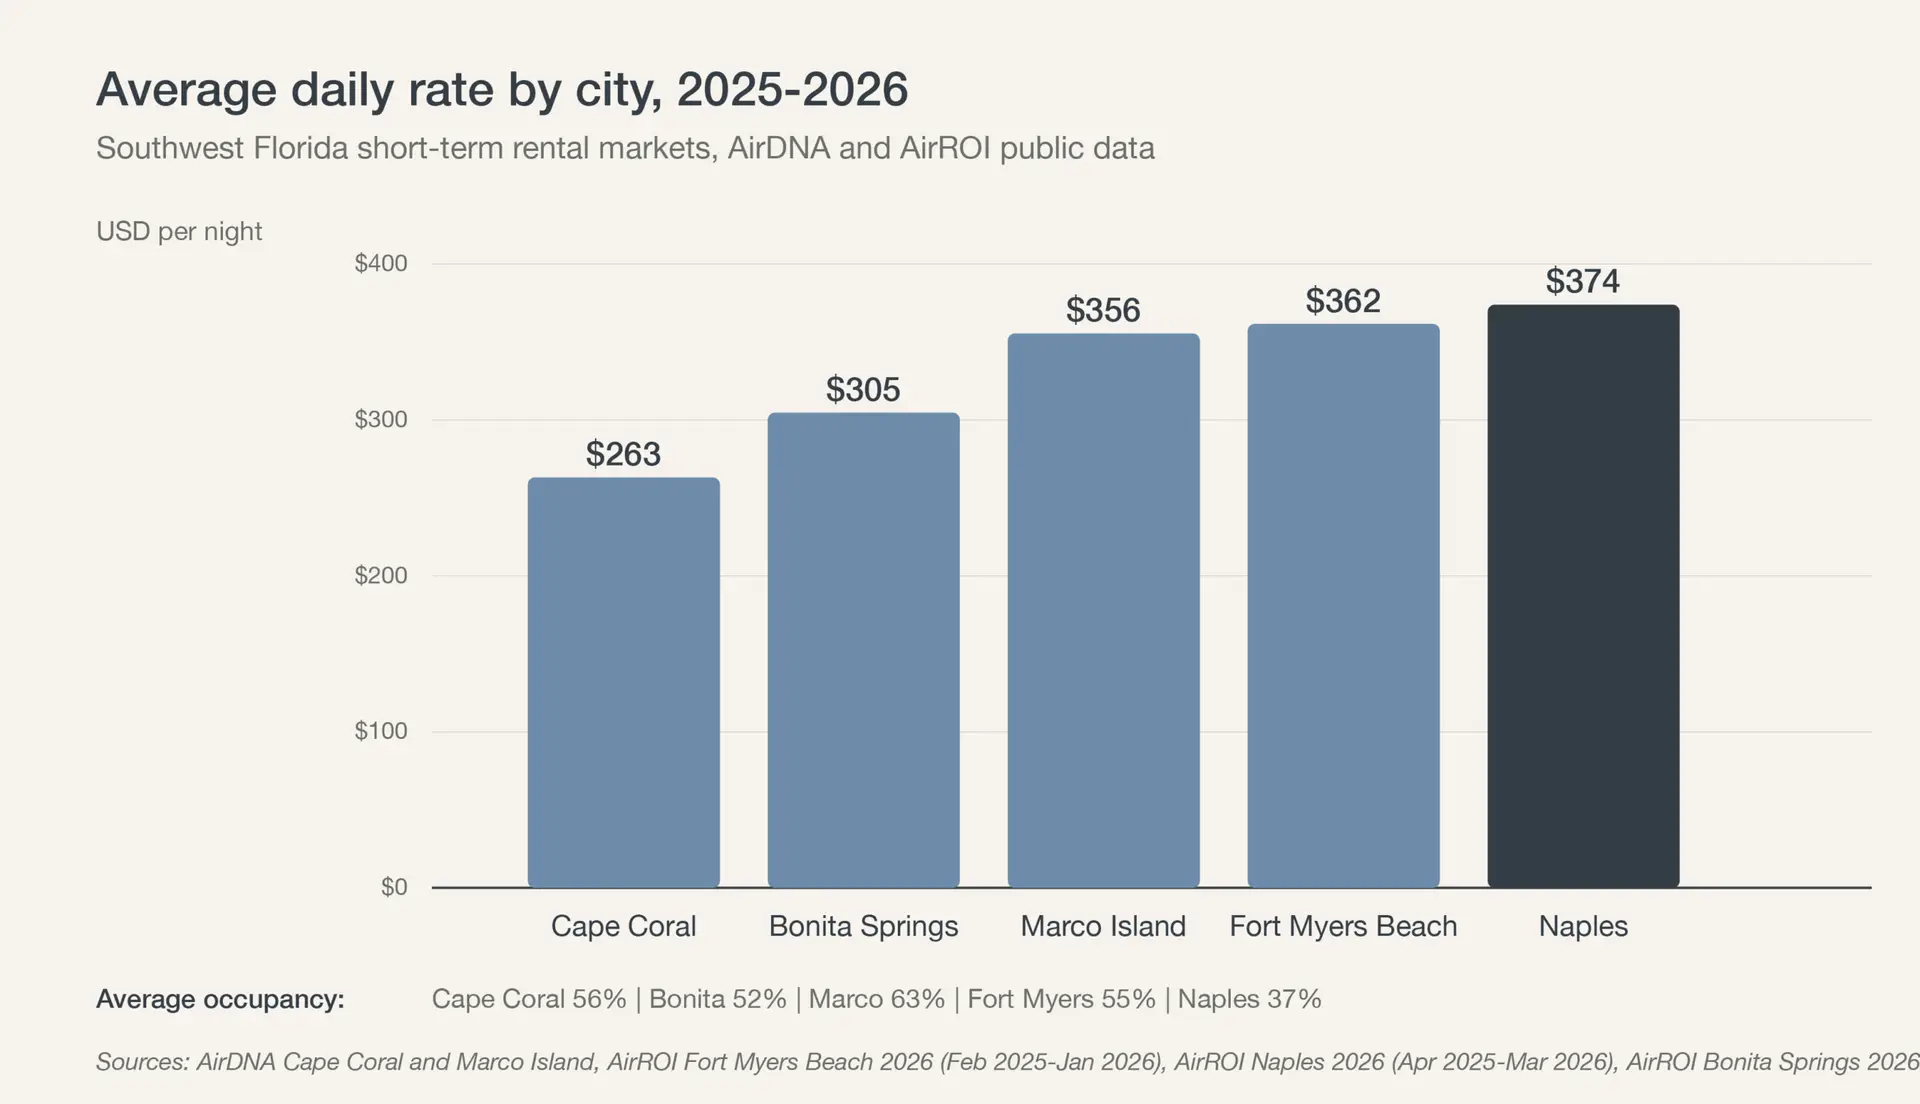
Sarasota on the northern edge is the highest-earning market at $58,452 gross per home per year, followed by Naples at $53,803, Cape Coral and Fort Myers at $44,984, and Punta Gorda at $37,514. Occupancy is close to identical across the region at 58 to 62 percent, so the difference between markets is almost entirely the daily rate.
| Market | Active listings | Average ADR | Average occupancy | Average gross per year | Median gross per year |
|---|
| Sarasota (northern edge) | 15,387 | $340.44 | 62% | $58,452 | $44,947 |
| Naples | 5,742 | $327.17 | 58% | $53,803 | $43,529 |
| Cape Coral / Fort Myers | 11,826 | $276.39 | 58% | $44,984 | $36,547 |
| Punta Gorda | 2,768 | $219.87 | 58% | $37,514 | $30,681 |
| Southwest Florida total | 35,723 | ~$308 | ~59% | ~$51,600 | not applicable |
Source: AirDNA, 27 June 2026, Southwest Florida market averages. The Southwest Florida total is listing-weighted across the four markets and is pulled upward by Sarasota. For a Lee County property, the Cape Coral and Fort Myers row is the right reference, not the regional total.
Naples: the strongest mainland market
Naples averages $53,803 gross per home per year at a $327.17 daily rate and 58 percent occupancy, across 5,742 active listings. RevPAR is $193.14. Supply moved down 1.4 percent year over year, the only market in the region where listing count contracted rather than grew.
The daily rate is what separates Naples from Lee County. A whole-home listing in Naples averages $331.44 per night, a professionally managed home averages $375.31, and the luxury tier averages $585.47. Booking lead time averages 72 days, the longest in the region, which points to planned destination travel rather than last-minute trips.
Four of the ten highest-earning neighborhoods in Southwest Florida sit inside the Naples market: Marco Island, Naples Park, Downtown Naples and Vineyards. That concentration is why Naples and the surrounding coast, rather than the inland volume markets, carry the strongest per-home economics in the region.
The coast earns most: neighborhood ranking
Captiva is the highest-earning neighborhood in Southwest Florida at $102,696 gross per home per year, followed by Boca Grande at $94,375 and Sanibel at $68,439. Every neighborhood in the top ten is on or beside the water. Inland neighborhoods do not appear in the ranking at all.
| Neighborhood | Market | Average gross per year |
|---|
| Captiva | Cape Coral / Fort Myers | $102,696 |
| Boca Grande | Punta Gorda | $94,375 |
| Sanibel | Cape Coral / Fort Myers | $68,439 |
| Marco Island | Naples | $61,709 |
| Naples Park | Naples | $58,529 |
| Fort Myers Beach | Cape Coral / Fort Myers | $56,425 |
| Downtown Naples | Naples | $54,404 |
| Nokomis Beach | Sarasota (northern edge) | $52,821 |
| Placida | Punta Gorda | $49,166 |
| Vineyards | Naples | $48,303 |
Source: AirDNA, 27 June 2026, Southwest Florida neighborhood averages. Captiva, Boca Grande and Placida are small islands with very few homes, so the average sits high on a thin sample. Sanibel, Marco Island, Naples Park, Fort Myers Beach, Downtown Naples and Nokomis Beach are the neighborhoods where the numbers and the available inventory both hold up.
Cape Coral and Fort Myers: the volume market
The Cape Coral and Fort Myers market averages $44,984 gross per home per year at a $276.39 daily rate and 58 percent occupancy, across 11,826 active listings. Supply grew 1.9 percent year over year. Inside that market, a home in Cape Coral itself averages $41,690 at a $257.47 daily rate, and a home in Fort Myers averages $33,886 at a $170.02 daily rate.
This is the deepest market in the region by listing count, which means the most competition for visibility and the most room for a well-run listing to pull away from the median. The coastal neighborhoods inside the same market tell a different story: Sanibel averages $68,439 and Fort Myers Beach $56,425, both well above the market average.
For the operational view on this market, see Cape Coral vacation rental management.
What professional management changes
Professionally managed homes carry a higher daily rate than the market average in every Southwest Florida market. In Cape Coral and Fort Myers the professionally managed average daily rate is $335.82 against $276.39 market-wide. In Naples it is $375.31 against $327.17. In Sarasota $466.78 against $340.44, and in Punta Gorda $292.04 against $219.87.
That is a rate difference, not a promise of higher net income. A management fee comes off the top, and the honest comparison is net against net. Vacation rental management fees sets out what sits inside a full-service percentage and what usually gets billed on top elsewhere. The self-management versus property manager comparison runs the same numbers from the owner side.
Season: March is the peak, September the trough
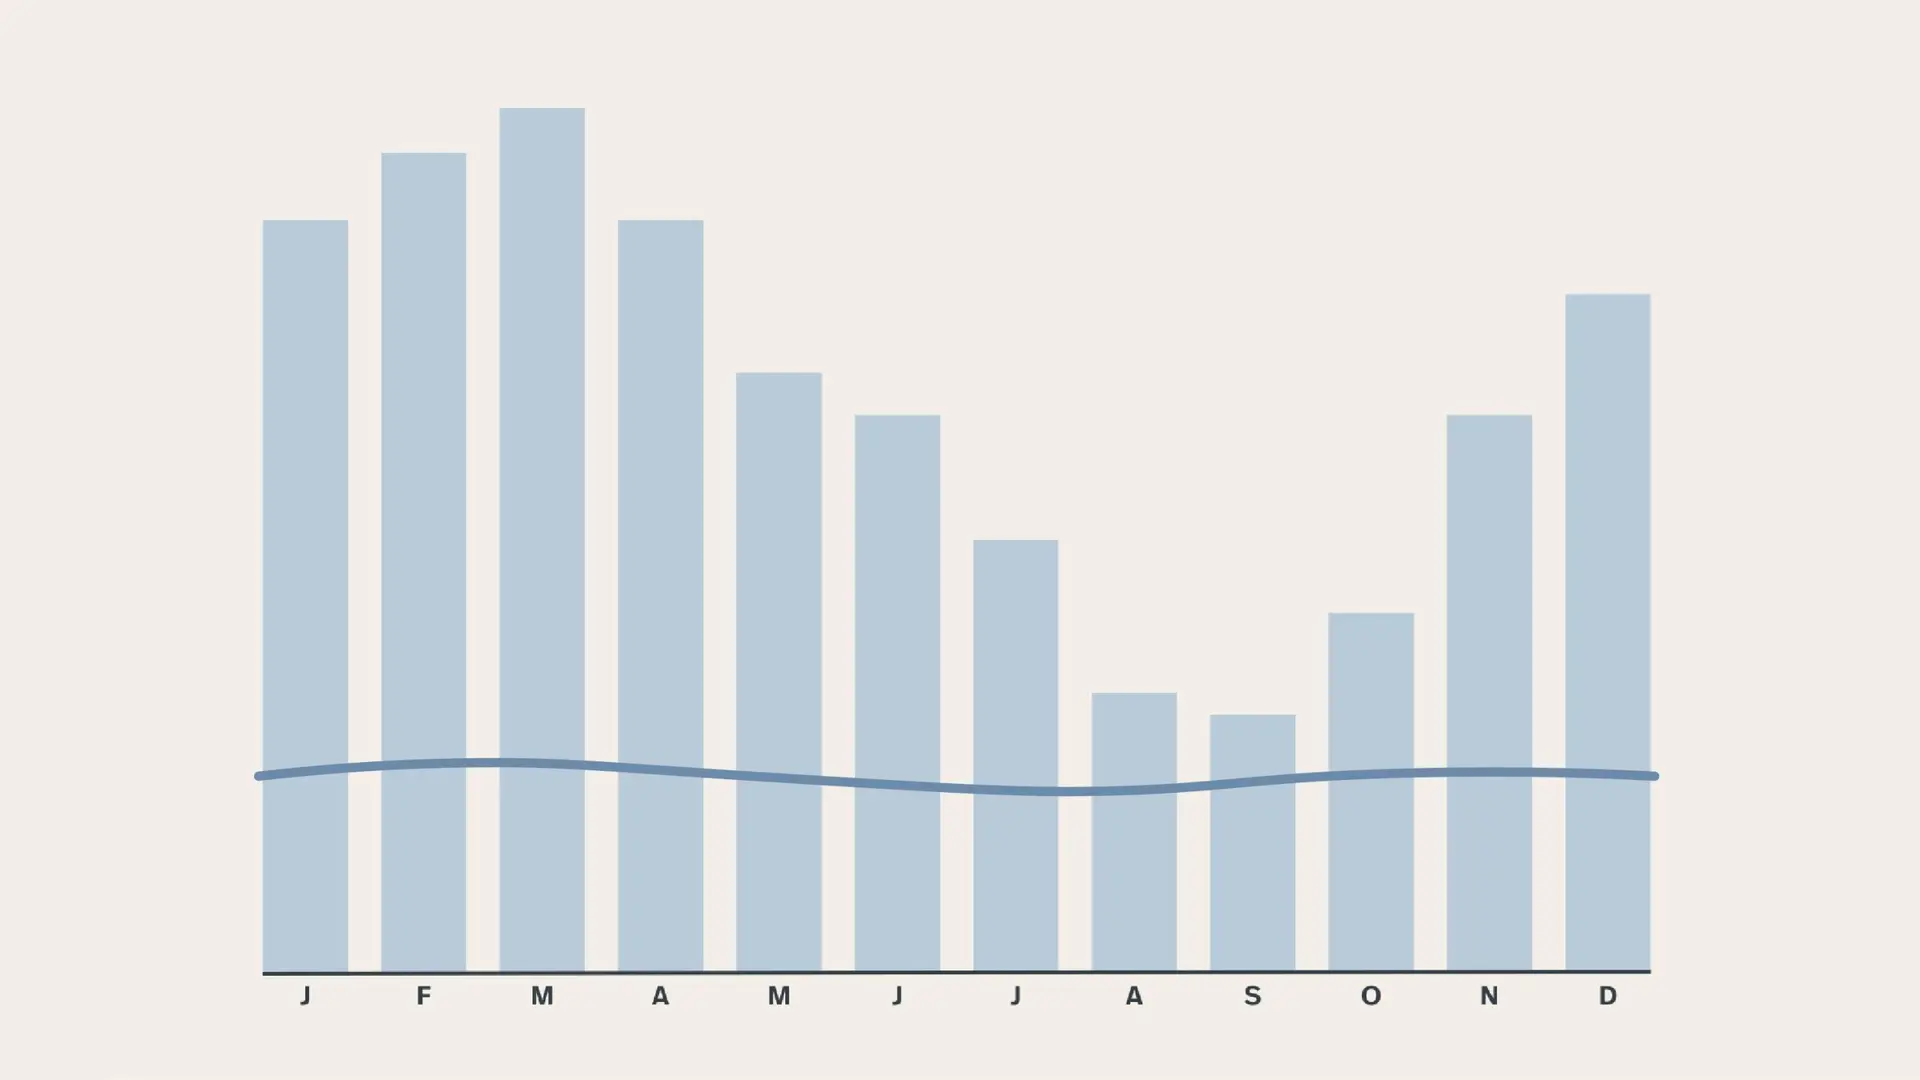
March is the strongest month in Cape Coral and Fort Myers, Naples and Sarasota. Punta Gorda peaks one month earlier in February. September is the weakest month in all four markets. The regional pattern is a high season in February and March and a trough in late summer and early fall.
Average length of stay is seven nights in three of the four markets and six nights in Sarasota. Booking lead time runs from 61 days in Punta Gorda to 72 days in Naples. Those two numbers matter more for pricing strategy than the annual average does, because they set how far ahead the peak weeks need to be priced correctly.
Why two similar homes earn very differently
Across the four markets, a home at the 25th percentile grosses roughly $17,000 to $24,000 a year while a home at the 90th percentile grosses $70,200 to $121,400. The median sits at $30,700 to $44,900 and the 75th percentile at $49,300 to $76,200. That is a four to five times spread inside the same region.
Two comparable homes on the same street can produce very different annual income. Location, size, condition, amenities, management and seasonality all move the result, and the ones an owner still controls after purchase are condition, amenities and management.
Which market matches which strategy
Naples and the coastal neighborhoods suit owners who want the highest rate per night and are comfortable with planned, longer-lead bookings. Marco Island, Naples Park, Downtown Naples and Vineyards are the four Naples-market neighborhoods in the regional top ten.
Sanibel and Fort Myers Beach suit owners who want coastal Lee County economics without leaving the county, at $68,439 and $56,425 average gross per year respectively.
Cape Coral and Fort Myers suit owners who want depth, volume and a market with a lot of comparable data behind pricing decisions. The trade-off is the most competition for visibility in the region.
Punta Gorda is the smallest of the four markets at 2,768 listings and the lowest average gross, with Boca Grande and Placida as the two high-earning outliers inside it.
Sources and method
All figures on this page come from AirDNA with a peak date of 27 June 2026, covering the Cape Coral and Fort Myers, Naples, Punta Gorda and Sarasota markets and 40 neighborhoods inside them.
These figures are Southwest Florida market averages from AirDNA (June 2026), measured across many different properties. Every home is unique. Actual income depends on location, size, condition, amenities, management and seasonality, so individual results vary. Use this as a market reference, not a guarantee or a forecast for any specific home.
Property care beyond rentals
If your Southwest Florida property also needs care when it is not rented, our sister company Suncoast Property Care handles home watch, maintenance and year-round care across Lee and Collier County. See suncoastpropertycare.com for certified home watch and full property care services.
Want the numbers for your own address instead of the market average? Request a free property review, or run a first estimate yourself with the income calculator.